This tool enables users to understand the BERT model by exploring and inspecting data at different layers and components. It allows users to visualize data in text and grid formats and navigate through variables, epochs, and data samples.
Model
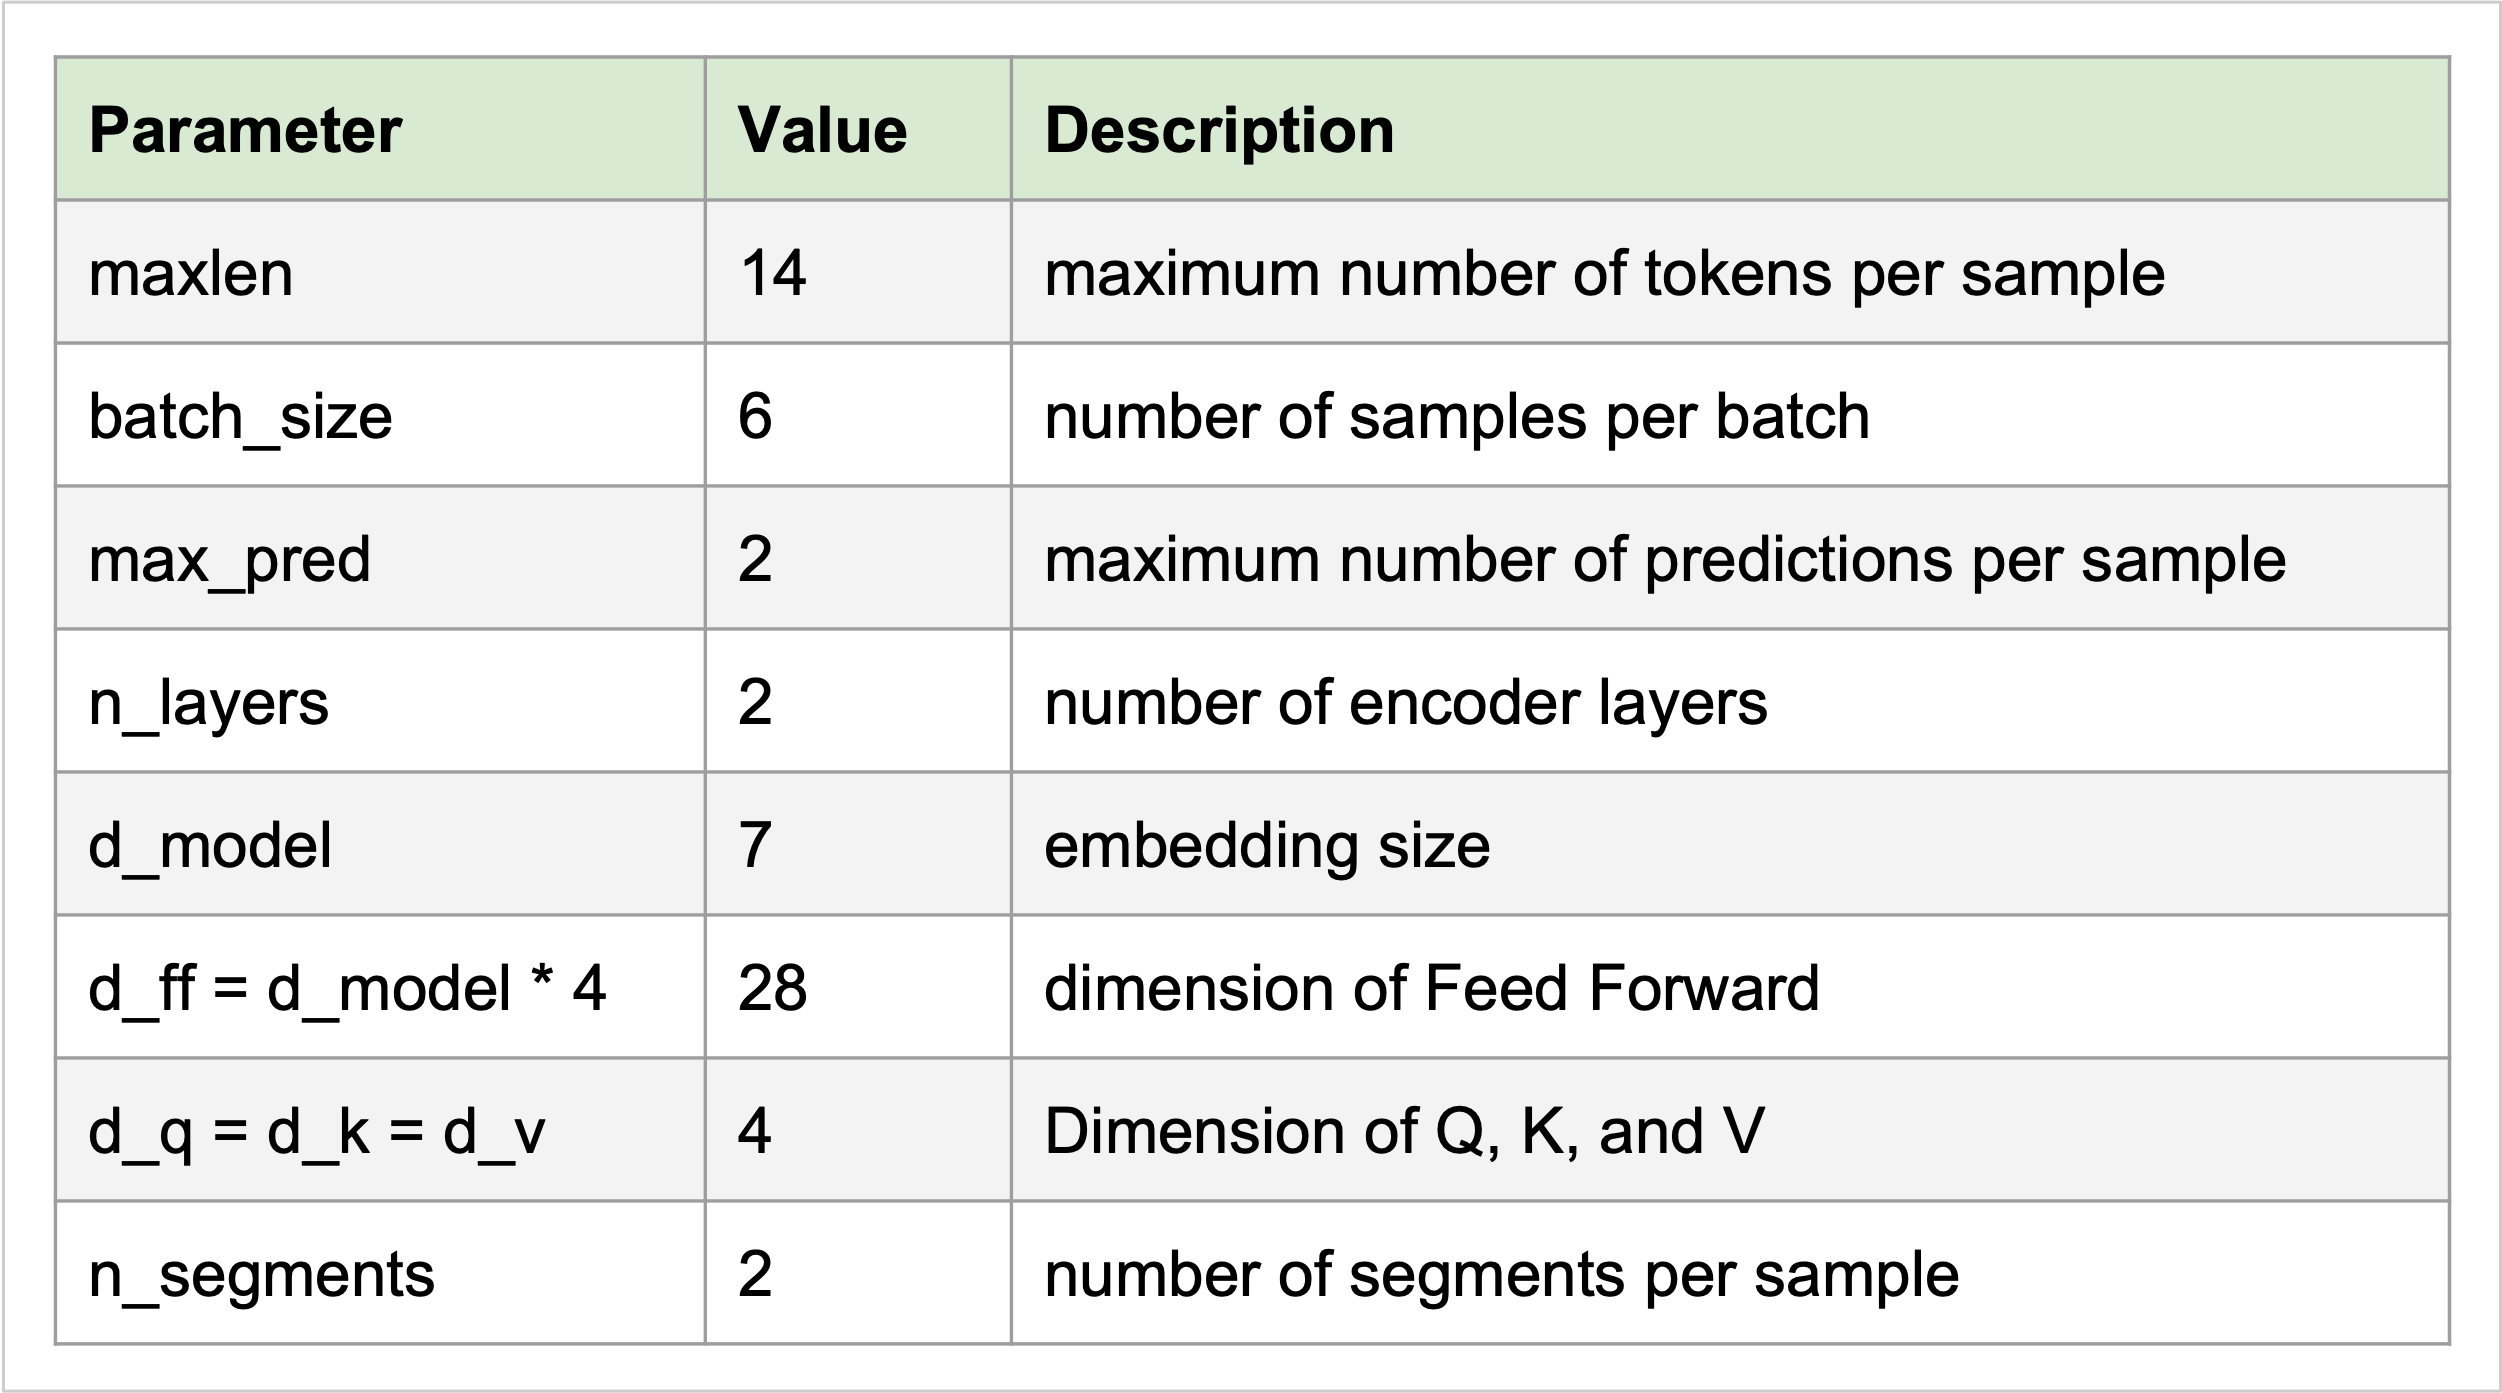
Configuration
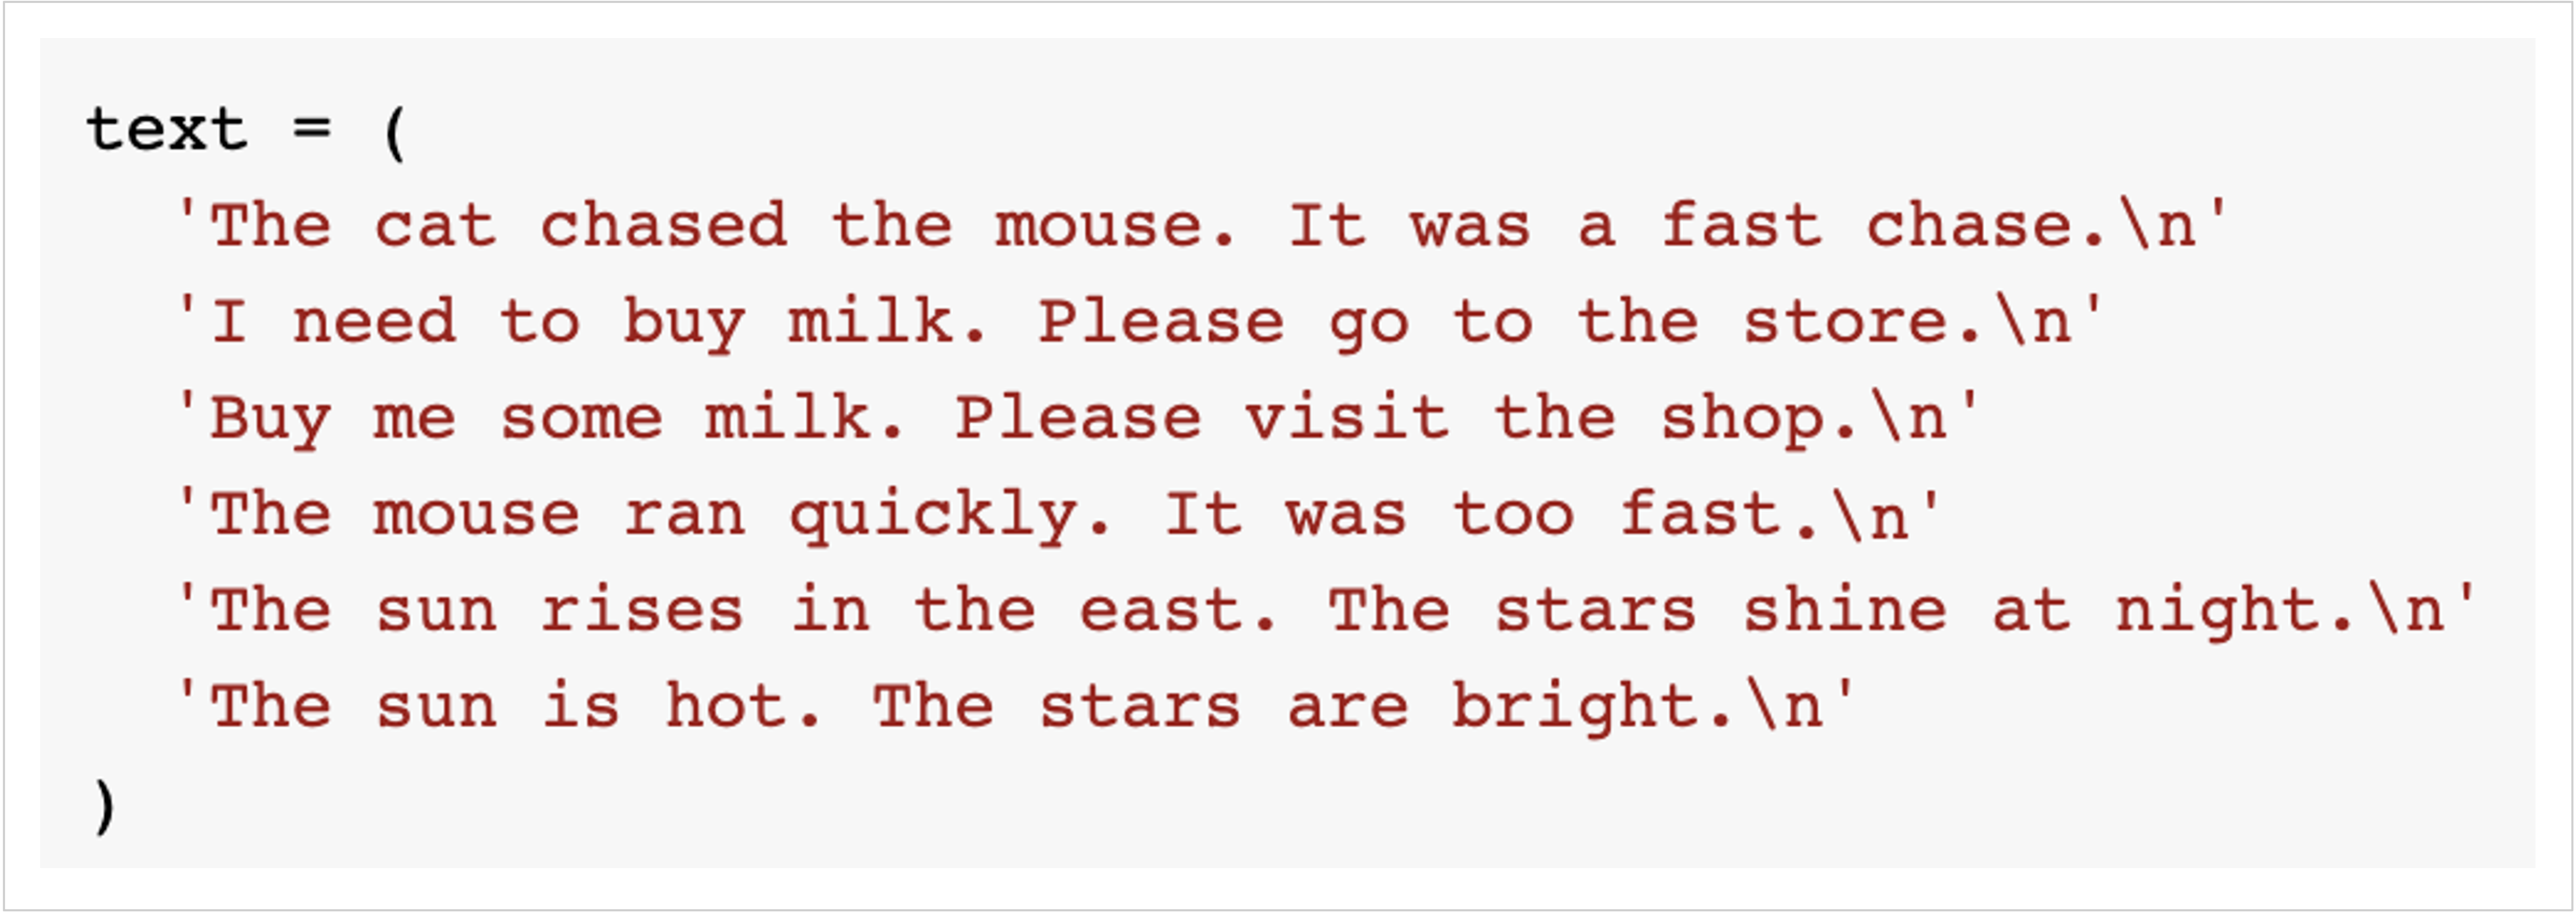
Input text
Masked input text

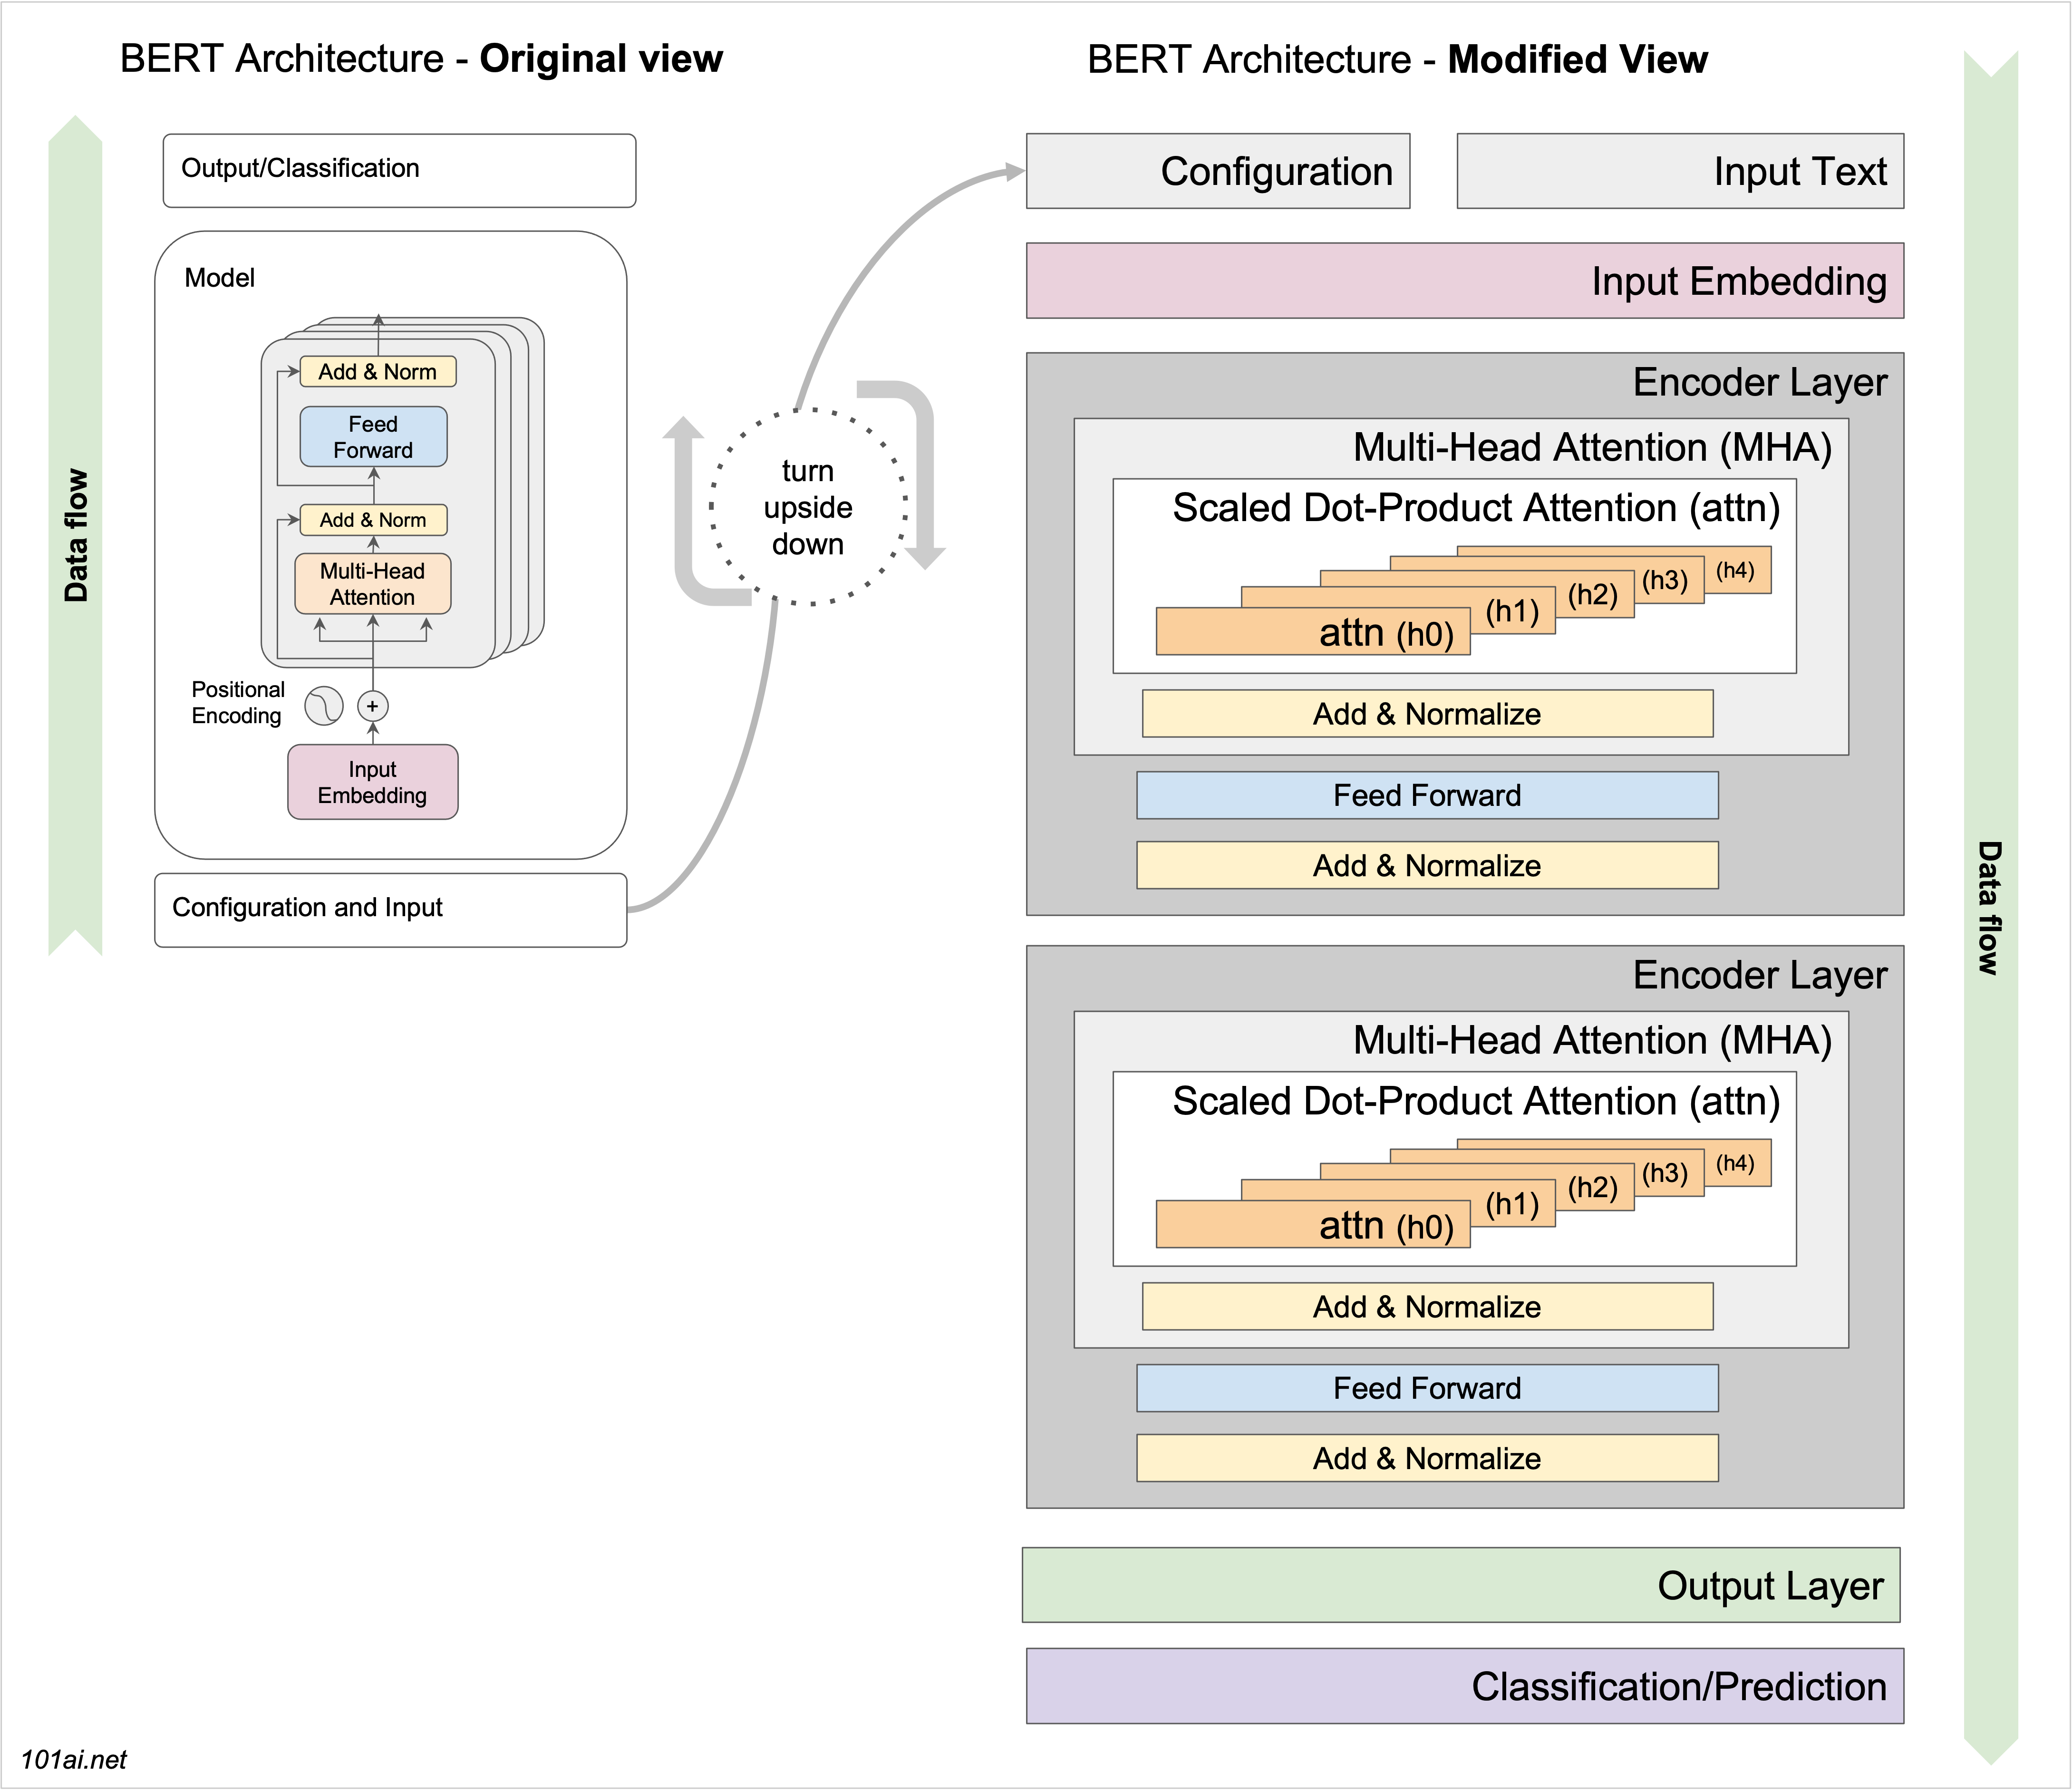
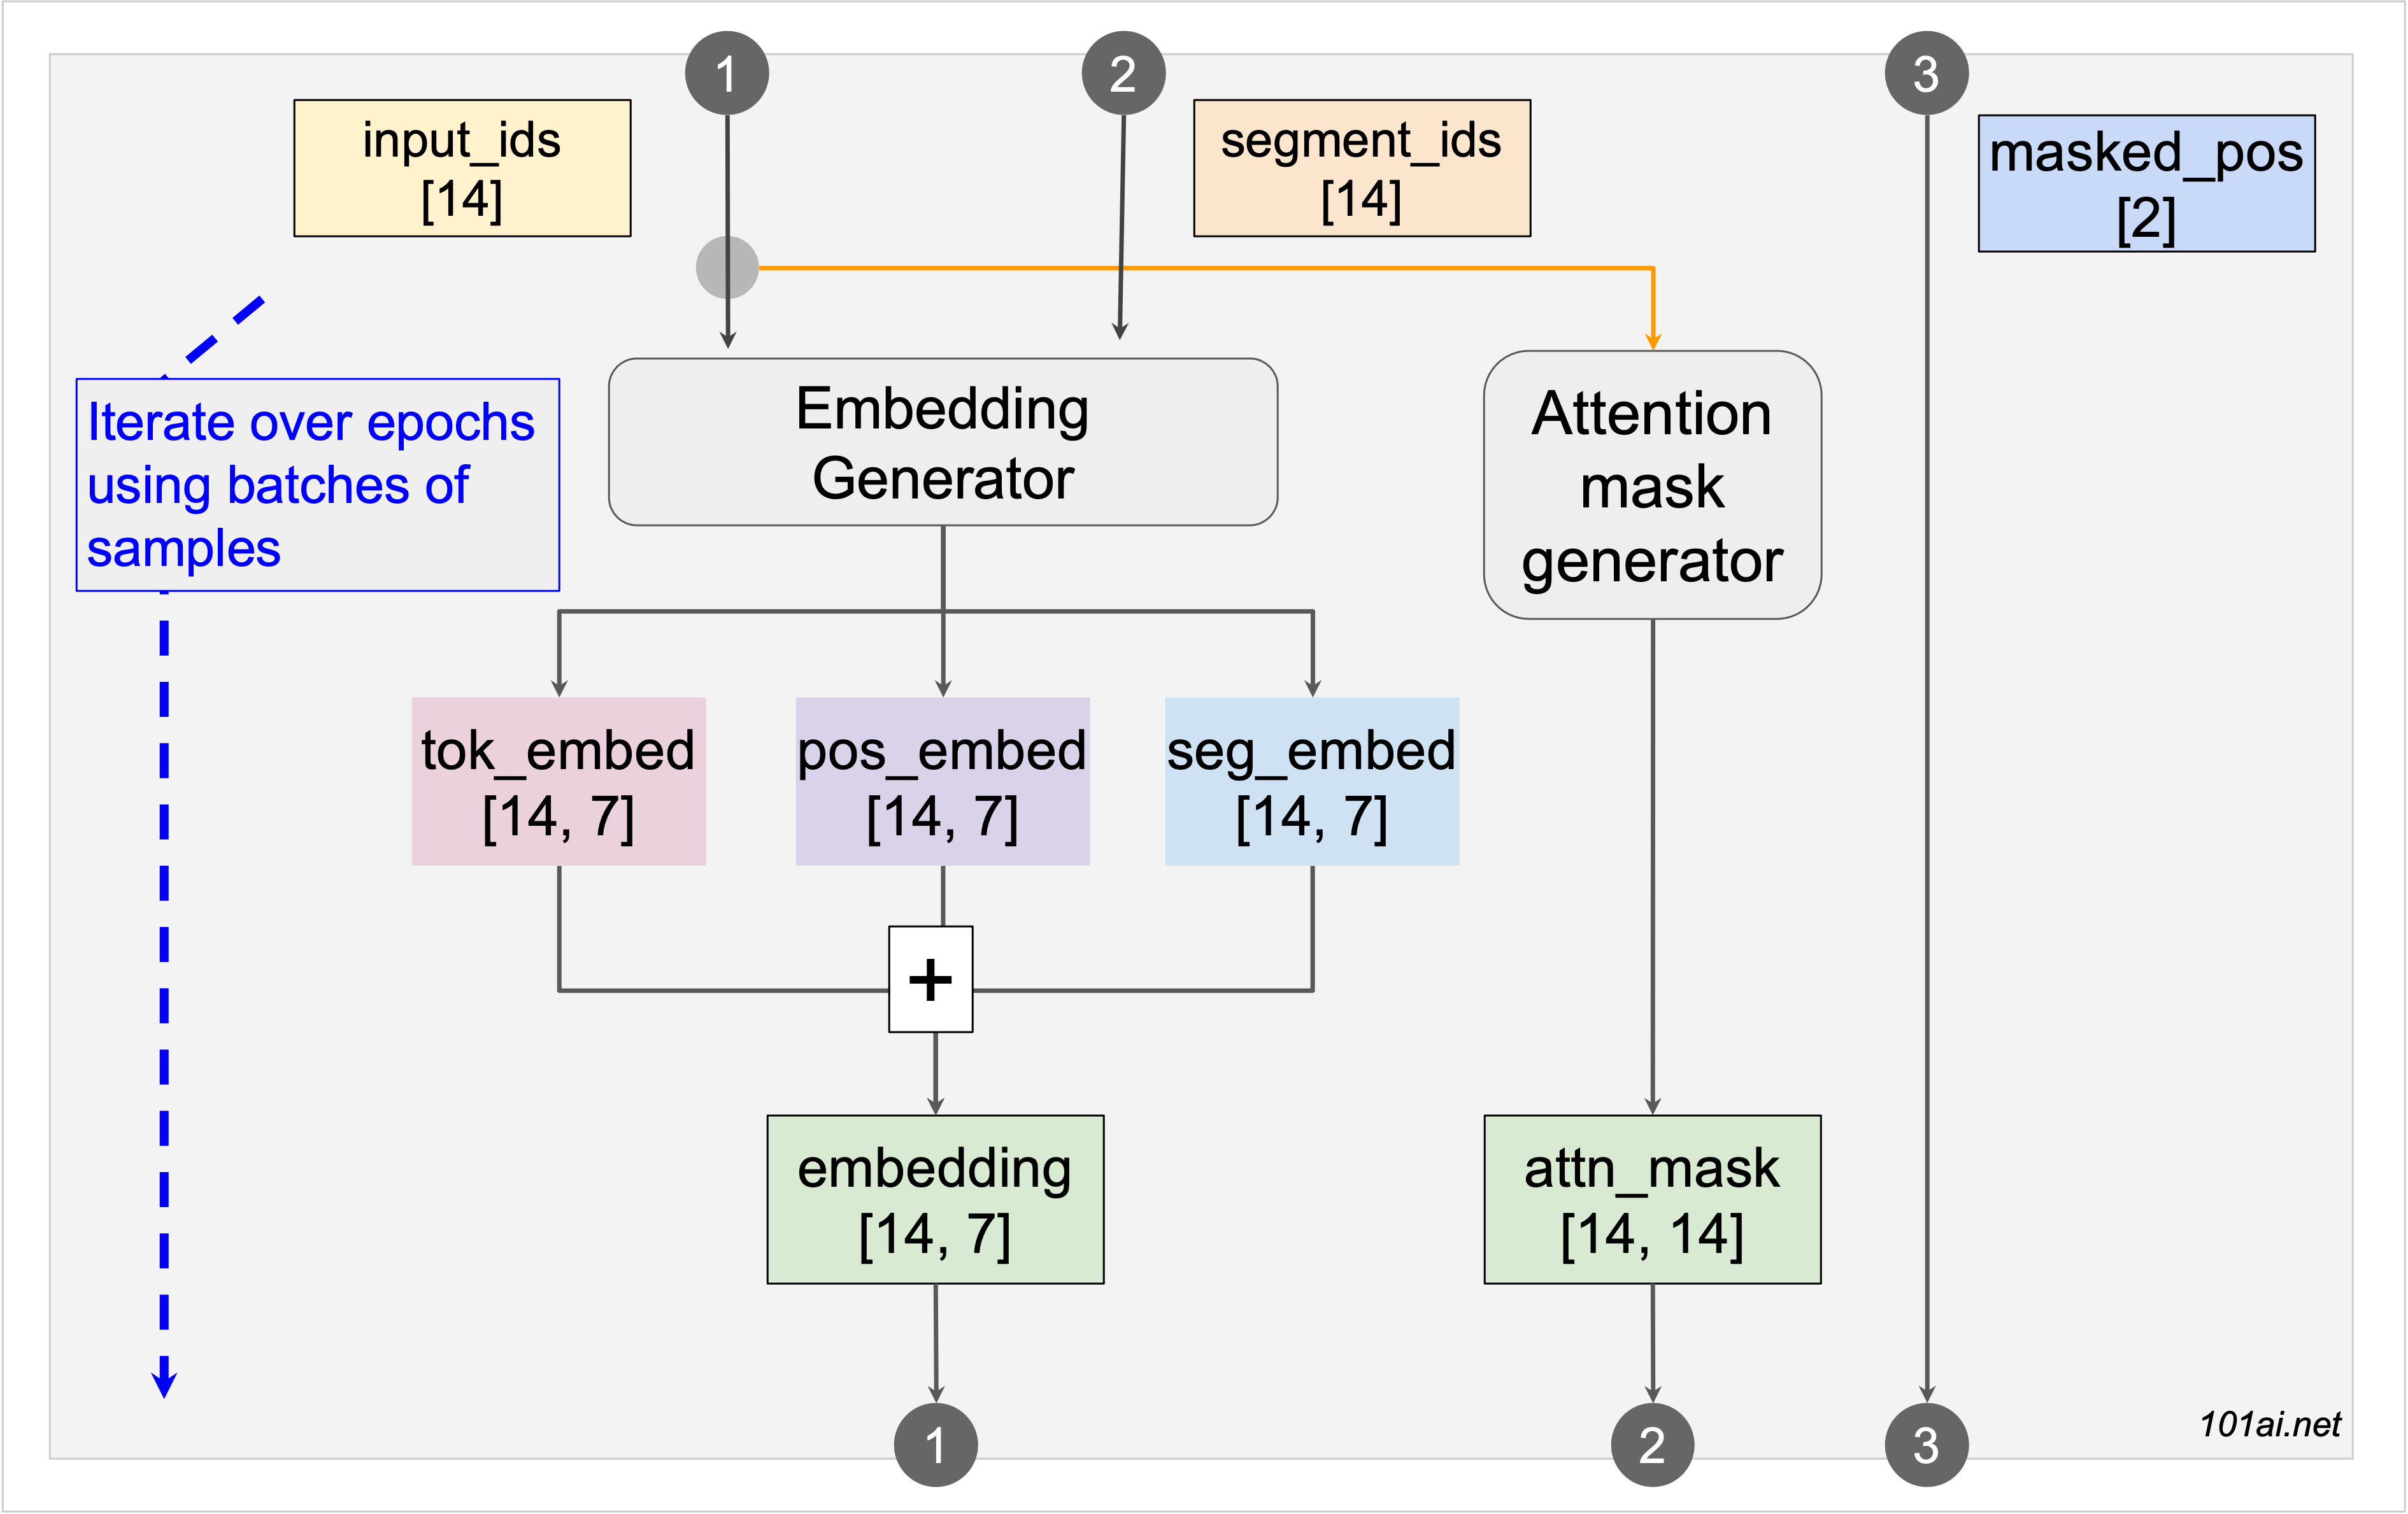
The diagrams below are equipped with clickable image maps that allow you to access and view data elements.
Input tokens

Training
Input Embedding
Encoder Layer 0
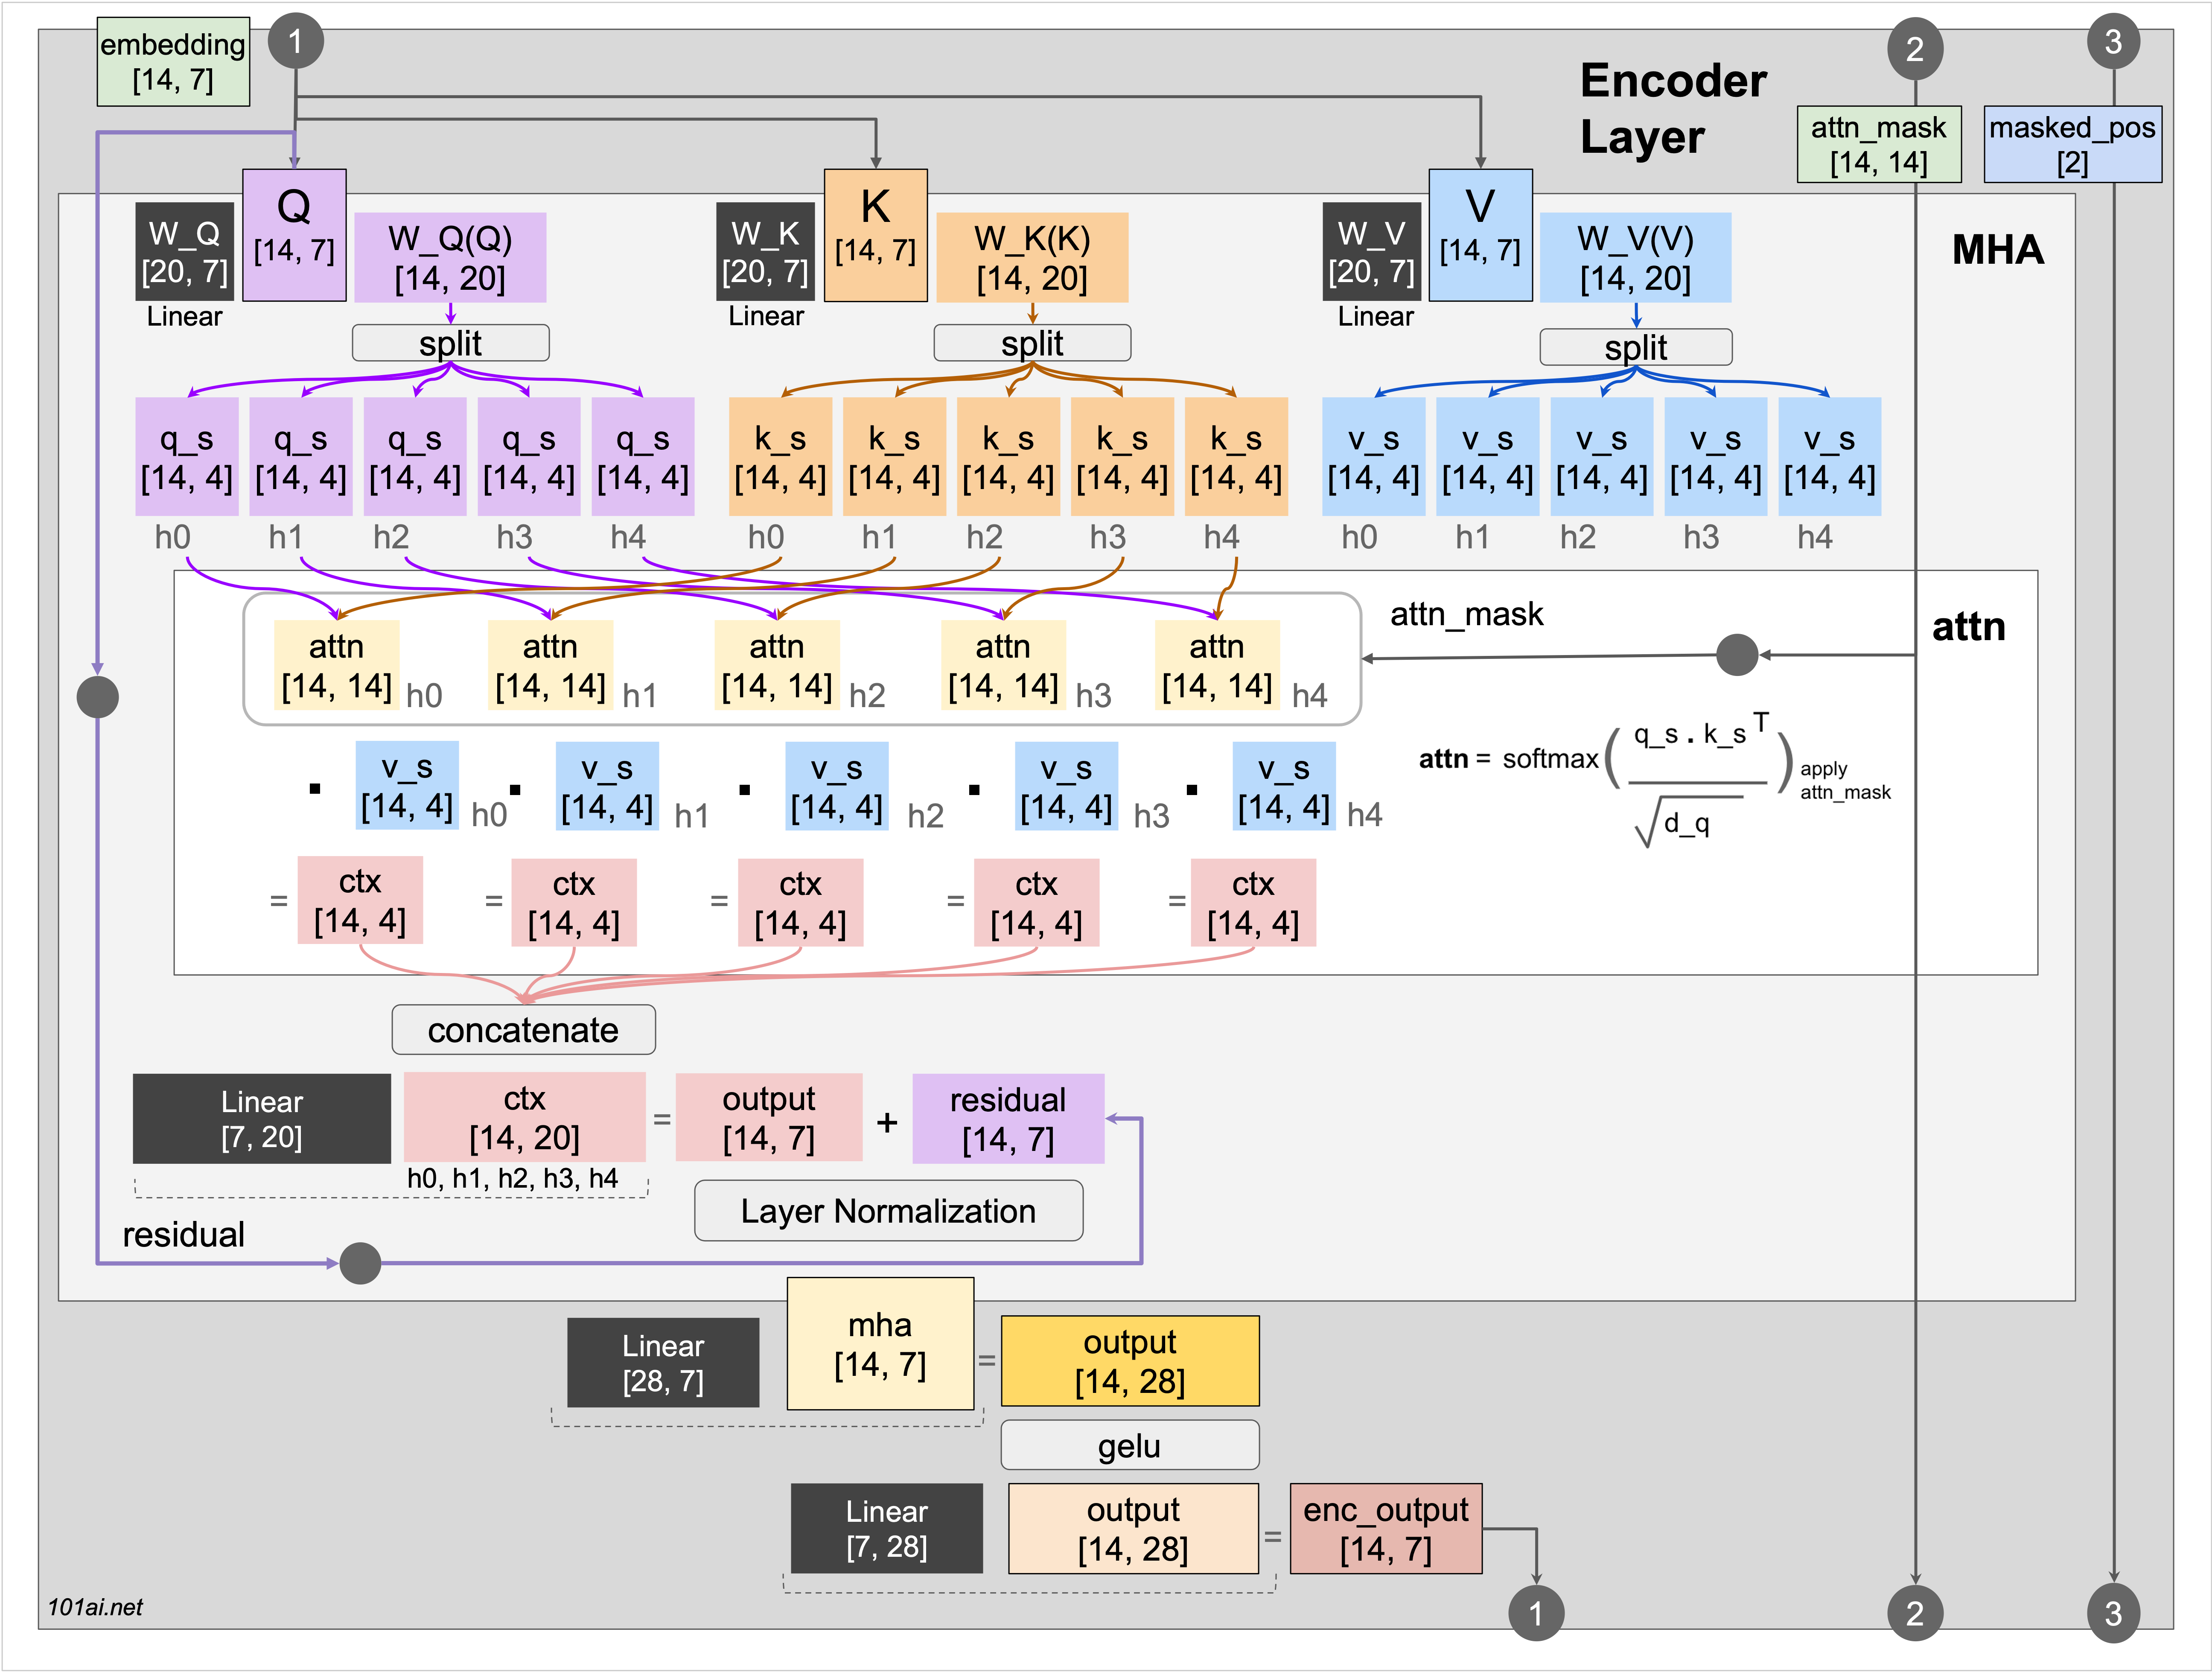
Encoder Layer 1

Output layer
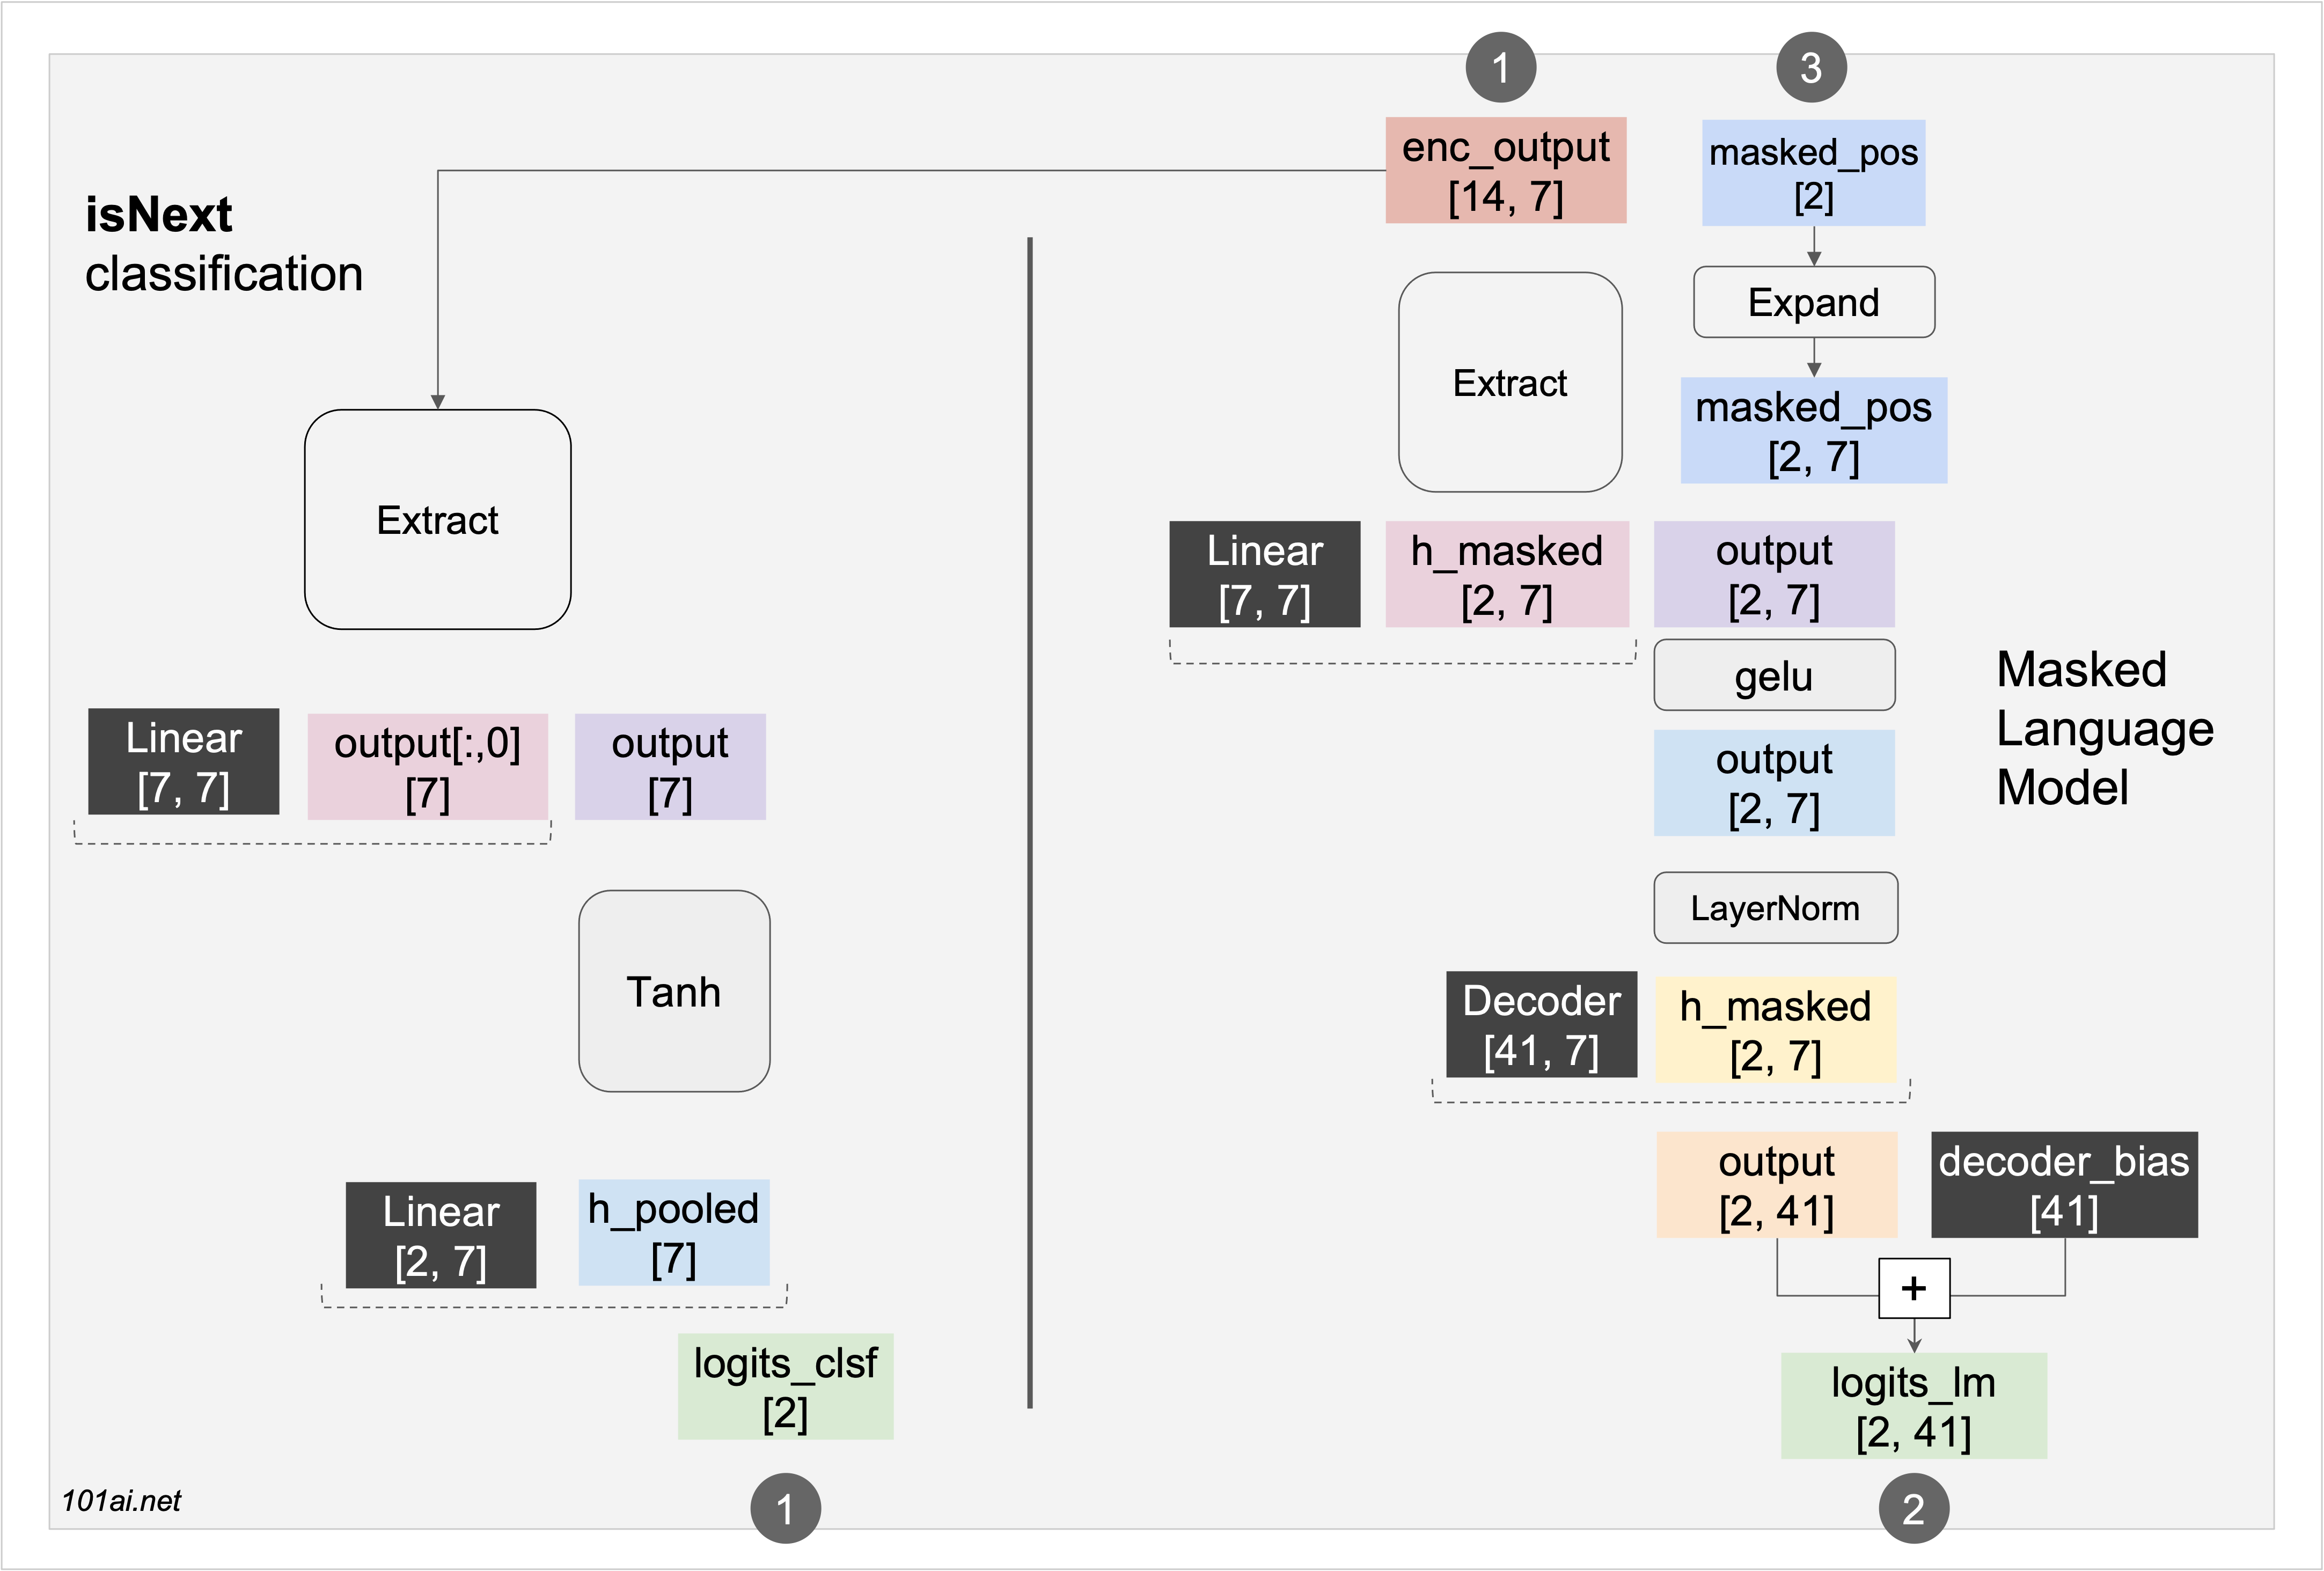
Prediction
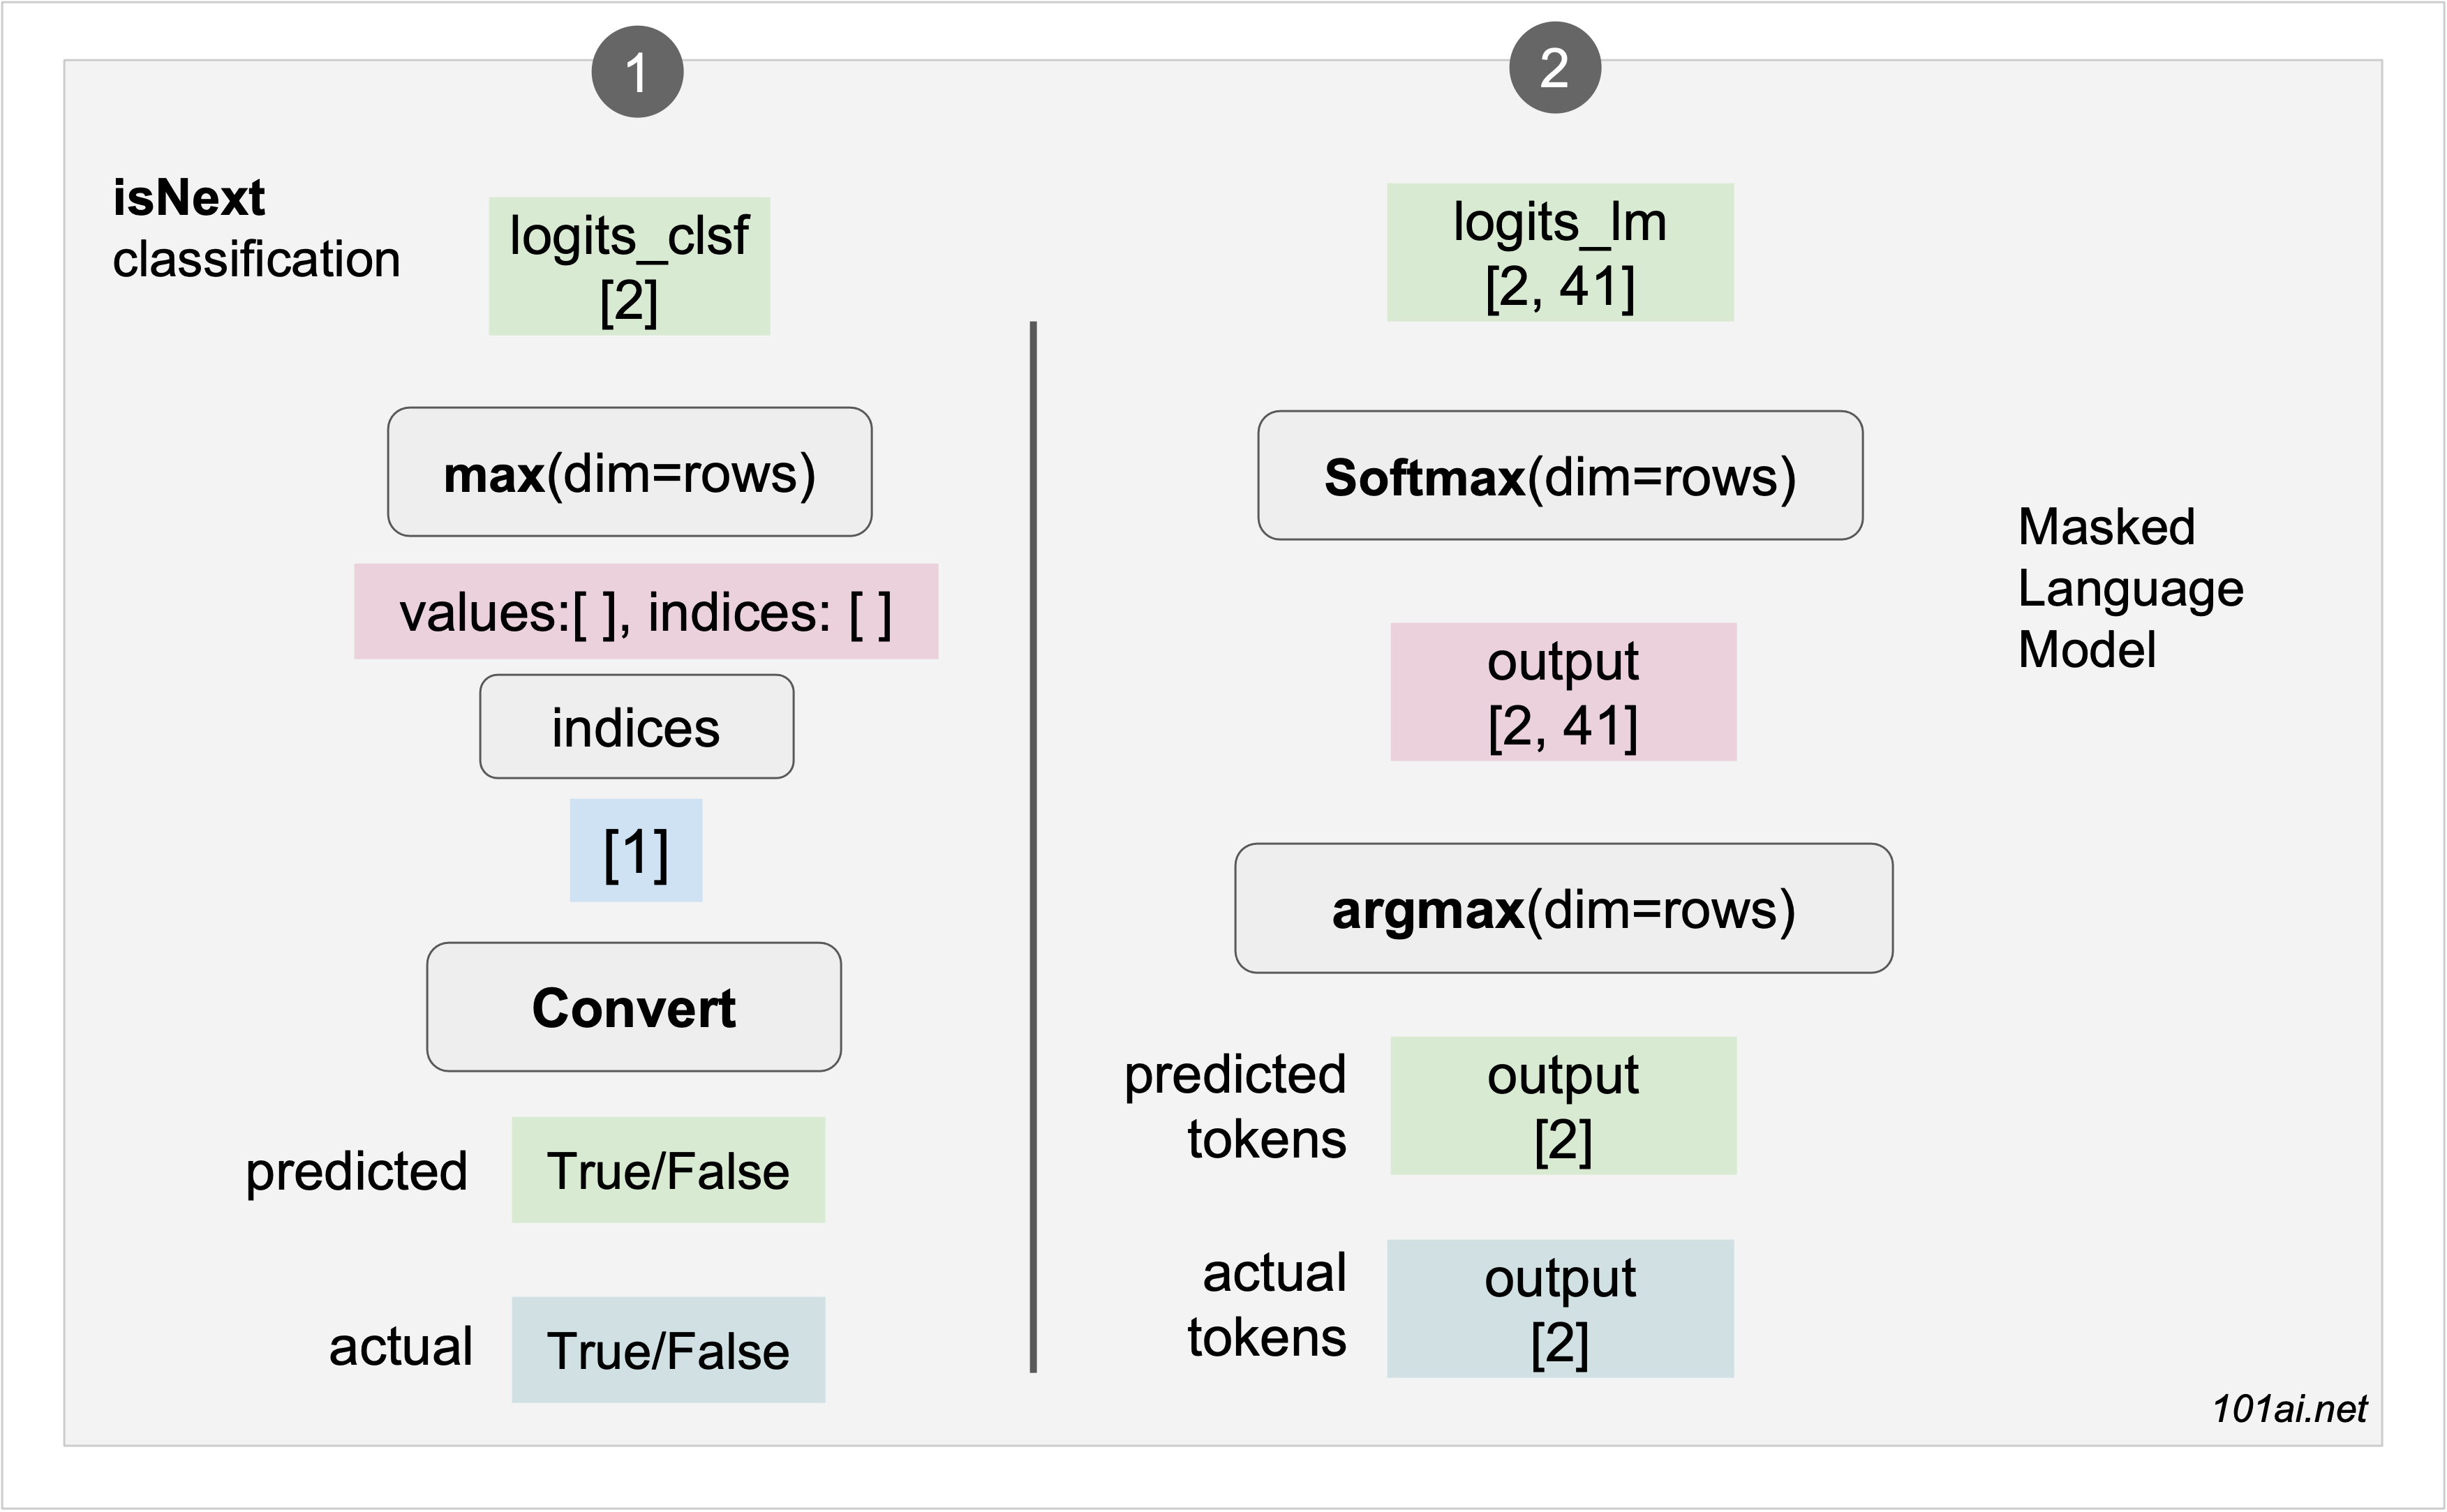
Comments & feedback: link